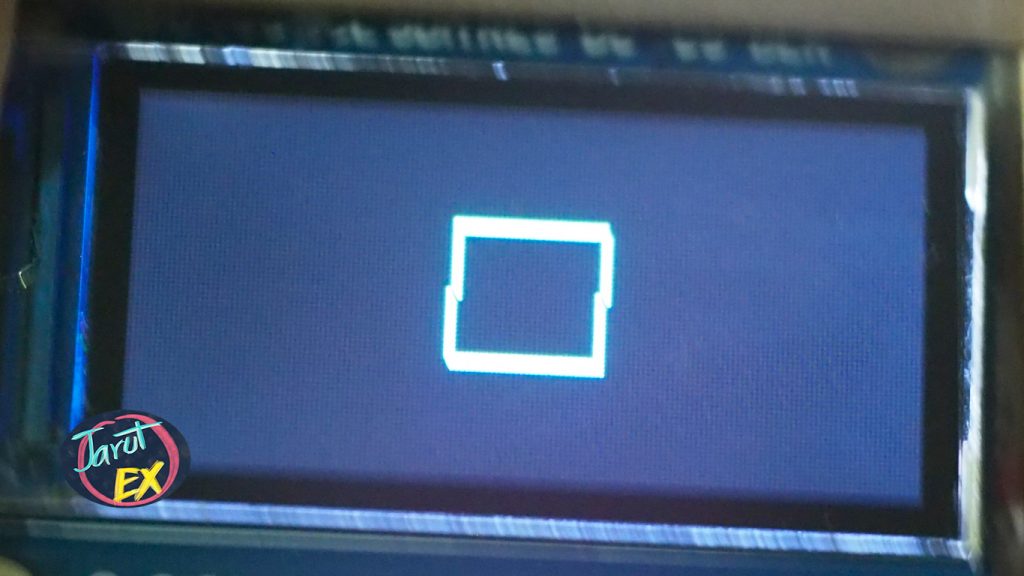
This article uses the ESP32 to rotate squares using the ulab library and to display the results of the calculations on the ST7735s LCD graphics module as written in the previous article. The example of the program consists of rotating a square in a clockwise direction and rotating multiple squares in opposite directions
Equipment
The experimental instruments are
Example Code
The example code18-9 rotates a rectangle from angles 0 to 359 by drawing a line from 4 vertices and calculating the rotation with the ulab library (read the article here). The result is shown in Figure 1.
# code18-9
from st7735 import TFT
from machine import SPI,Pin
import machine as mc
import time
import math
import ulab as np

minX = -10.0
maxX = 10.0
minY = -5.0
maxY = 5.0
scrWidth = const(160)
scrHeight = const(80)
ratioX = float(scrWidth)/(math.fabs(minX)+math.fabs(maxX)+1)
ratioY = float(scrHeight)/(math.fabs(minY)+math.fabs(maxY)+1)
centerX = const(scrWidth >> 1)
centerY = const(scrHeight >> 1)

spi = SPI(1, baudrate=20000000,
          sck=Pin(14), mosi=Pin(13),
          polarity=0, phase=0)
# dc, rst, cs
tft=TFT(spi,2,None,15)
tft.init_7735(tft.GREENTAB80x160)


def rotate(pX,pY,angle):
    rad = math.radians(angle)
    xCos = pX*np.vector.cos(rad)
    ySin = pY*np.vector.sin(rad)
    xSin = pX*np.vector.sin(rad)
    yCos = pY*np.vector.cos(rad)
    newX = xCos - ySin
    newY = xSin + yCos
    return (newX, newY)

def draw(pX, pY,aColor=tft.WHITE):
    newPx = np.array(pX*ratioX+centerX,dtype=np.uint16)
    newPy = np.array(pY*ratioY+centerY,dtype=np.uint16)
    tft.line((newPx[0],newPy[0]),(newPx[1],newPy[1]),aColor)
    tft.line((newPx[1],newPy[1]),(newPx[2],newPy[2]),aColor)
    tft.line((newPx[2],newPy[2]),(newPx[3],newPy[3]),aColor)
    tft.line((newPx[3],newPy[3]),(newPx[0],newPy[0]),aColor)

# main program
tft.rotation(1)
tft.fill(tft.BLACK)

t0 = time.ticks_us()
pX = np.array([-2,2,2,-2],dtype=np.float)
pY = np.array([2,2,-2,-2],dtype=np.float)
for degree in range(360):
    newP = rotate(pX,pY,degree)
    draw(newP[0],newP[1],tft.WHITE)
    time.sleep_ms(100)
    tft.fill(0)
for degree in range(360):
    newP = rotate(pX,pY,-degree)
    draw(newP[0],newP[1],tft.CYAN)
    time.sleep_ms(100)
    tft.fill(0)
print("ulab: Delta = {} usec".format(time.ticks_us()-t0))

# endof program
time.sleep_ms(2000)
tft.on(False)
spi.deinit()

The example code18-10 adds three more rectangles calculated by expanding the object from the first rectangle and ordered the drawing to rotate in a reverse direction with each piece turning opposite each other alternately. The result is shown in Figure 2.
# code18-10
from st7735 import TFT
from machine import SPI,Pin
import machine as mc
import time
import math
import ulab as np

minX = -10.0
maxX = 10.0
minY = -5.0
maxY = 5.0
scrWidth = const(160)
scrHeight = const(80)
ratioX = float(scrWidth)/(math.fabs(minX)+math.fabs(maxX)+1)
ratioY = float(scrHeight)/(math.fabs(minY)+math.fabs(maxY)+1)
centerX = const(scrWidth >> 1)
centerY = const(scrHeight >> 1)

spi = SPI(1, baudrate=20000000,
          sck=Pin(14), mosi=Pin(13),
          polarity=0, phase=0)
# dc, rst, cs
tft=TFT(spi,2,None,15)
tft.init_7735(tft.GREENTAB80x160)

def rotate(pX,pY,angle):
    rad = math.radians(angle)
    xCos = pX*np.vector.cos(rad)
    ySin = pY*np.vector.sin(rad)
    xSin = pX*np.vector.sin(rad)
    yCos = pY*np.vector.cos(rad)
    newX = xCos - ySin
    newY = xSin + yCos
    return (newX, newY)

def scale(pX,pY,Sx=1.0,Sy=1.0):
    return ((pX*Sx, pY*Sy))

def draw(pX, pY,aColor=tft.WHITE):
    newPx = np.array(pX*ratioX+centerX,dtype=np.uint16)
    newPy = np.array(pY*ratioY+centerY,dtype=np.uint16)
    tft.line((newPx[0],newPy[0]),(newPx[1],newPy[1]),aColor)
    tft.line((newPx[1],newPy[1]),(newPx[2],newPy[2]),aColor)
    tft.line((newPx[2],newPy[2]),(newPx[3],newPy[3]),aColor)
    tft.line((newPx[3],newPy[3]),(newPx[0],newPy[0]),aColor)

# main program
tft.rotation(1)
tft.fill(tft.BLACK)

t0 = time.ticks_us()
pX = np.array([-0.5,0.5,0.5,-0.5],dtype=np.float)
pY = np.array([0.5,0.5,-0.5,-0.5],dtype=np.float)
p2 = scale(pX,pY,2.2,2.2)
p3 = scale(pX,pY,3.8,3.8)
p4 = scale(pX,pY,5.4,5.4)
for degree in range(0,361,4):
    tft.fill(0)
    newP = rotate(pX,pY,degree)
    newP2 = rotate(p2[0],p2[1],-degree)
    newP3 = rotate(p3[0],p3[1], degree)
    newP4 = rotate(p4[0],p4[1], -degree)
    draw(newP[0],newP[1],tft.WHITE)
    draw(newP2[0],newP2[1],tft.GREEN)
    draw(newP3[0],newP3[1],tft.CYAN)
    draw(newP4[0],newP4[1],tft.YELLOW)
for degree in range(0,361,8):
    tft.fill(0)
    newP = rotate(pX,pY,-degree)
    newP2 = rotate(p2[0],p2[1],degree)
    newP3 = rotate(p3[0],p3[1],-degree)
    newP4 = rotate(p4[0],p4[1],degree)
    draw(newP[0],newP[1],tft.WHITE)
    draw(newP2[0],newP2[1],tft.GREEN)
    draw(newP3[0],newP3[1],tft.CYAN)
    draw(newP4[0],newP4[1],tft.YELLOW)
print("ulab: Delta = {} usec".format(time.ticks_us()-t0))

# endof program
time.sleep_ms(2000)
tft.on(False)
spi.deinit()

Conclusion
From the examples in this chapter, we can see that the ulab operation allows multiple vectors or arrays of coordinates in the x and y axes to be processed in a single instruction. But the lost speed falls back on the display speed. However, The author hopes that this article will serve as an example and a guide for those who are interested in using Python to calculate mathematical values for further application in display or AI.
Finally, have fun with programming.
(C) 2020, By Jarut Busarathid and Danai Jedsadathitikul
Updated 2021-08-17