Posted inArduino Arduino C/C++ Cortex-M0 Cortex-M3 Cortex-M4 Data Structure English esp32 esp8266 STM32
[EN] Generate temperature and humidity graphs with data from Singly Linked List.
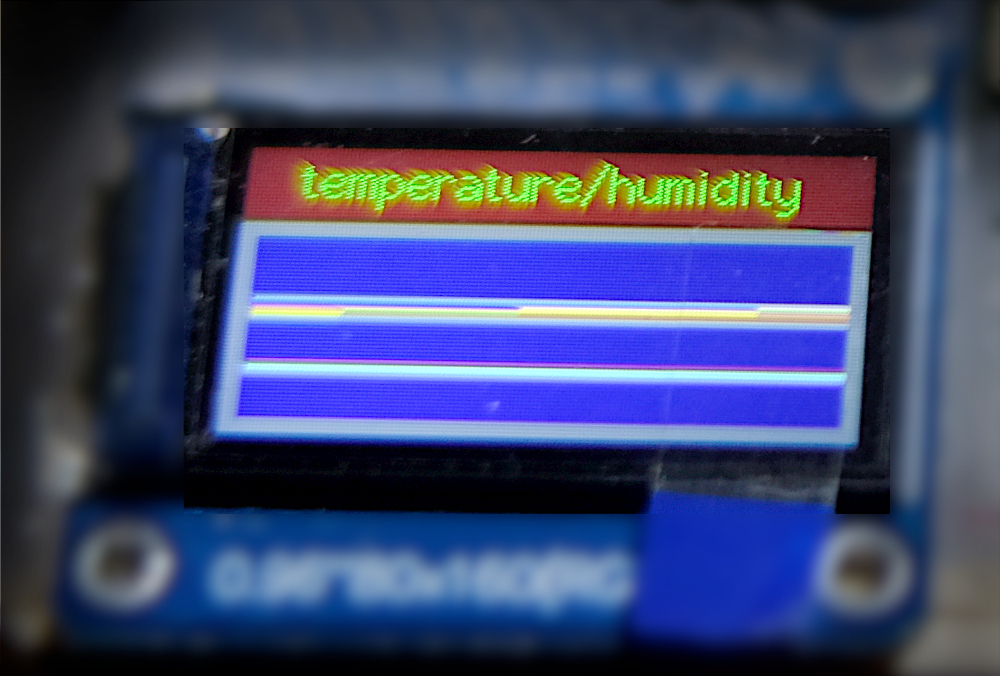
From the article Singly Linked List Data Structures, the use of the DHT11 sensor module with the STM32F103 microcontroller, and the use of the TFT display module based on the st7735s controller, the idea of this article is to take an example of using a singly linked list data structure to collect the temperature and humidity values to find the maximum, minimum, average, together with the data in the list to display in the form of a graph as shown in Figure 1.